- Research & Instruments
- How we study - Our instruments and methods
- Instruments and Methods
- On Land
- MALDI-Imaging mass spectrometer
MALDI-Imaging mass spectrometer
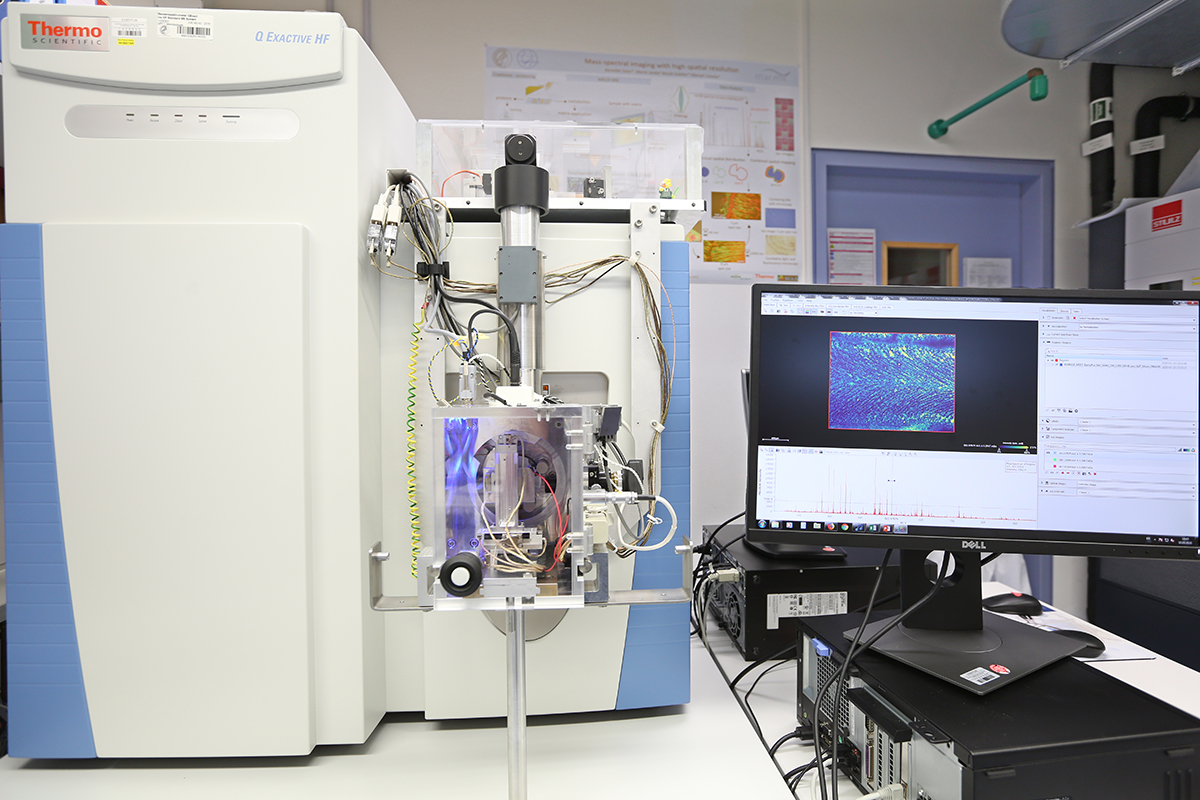
What is a MALDI imaging mass spectrometer?
MALDI imaging mass spectrometry is an imaging method for analysing chemical compounds and their spatial distribution in a sample. The abbreviation MALDI translates as matrix-assisted laser desorption/ionization. It can be used to identify where certain compounds are located in a sample. This not only shows which sugars and/or fats are contained in a mussel but also where they are located. Scientists can use this information to draw conclusions about how the metabolism of the mussel works.
The advantage over a mass spectrometer combined with a gas or liquid chromatograph is this additional local information. In order to create these chemical images, a laser from the MALDI source scans the biological sample in a grid of up to 10 µm – ten times thinner than a single human hair. In this way, extremely fine details and structures (e.g. individual animal cells) can be visualized. Because each grid point requires approx. 1 s of measurement time, measurements of a few square millimetres at high resolution can take up to several days. This means that not the whole mussel but rather only parts (e.g. the gills) can be measured.
How does the MALDI imaging mass spectrometer work?
First, the biological material is prepared for the measurement in such a way that both the tissue structure and the spatial distribution of the chemical compounds in the tissue remain intact. For this purpose, tissue that has been flash-frozen with liquid nitrogen is embedded in a carrier material. It is then frozen in a cryotome at −25°C, cut into ten-micrometre-thin sections, and placed flat on a microscope slide. In order to capture the structure of the tissue section, a photo is taken with a light microscope. A matrix solution is then applied with an airbrush-like sprayer. The matrix penetrates the top layer of the tissue and crystallizes during drying, and encloses the chemical compounds (e.g. sugar, protein, and fatty acids) in fine crystals. The finer the crystals, the more accurate the measurement result.
During the measurement, a focused laser shoots at the tissue sample and scans a specific area (for example 100 × 100 µm) with a grid width of 10 µm. This means that the laser shoots at the tissue every 10 µm. With each shot, the analytes are dissolved out (desorption) and acquire a positive charge (ionization) in the MALDI source. This charge is transferred from the matrix molecules. The charged ions are sorted and detected in the Orbitrap (an ion trap mass detector) according to their mass-to-charge ratio. The result of the measured area is summarized in an image, which is then divided into 10 × 10 µm pixels. Each of these pixels contains information in a spectrum about which different mass-to-charge ratios were measured at that position. With the Orbitrap mass spectrometer, this ratio can be measured very precisely – up to four decimal places. This high accuracy is referred to as high-resolution mass spectrometry. In this way, a spectrum can be obtained for each pixel. This allows conclusions to be drawn about the elemental composition of the chemical compounds and provides important information for structural elucidation.
Both the measured spectra and the corresponding image of the local distribution can also be loaded into databases. There you can get even more information about the compounds and their occurrence in different tissue types.
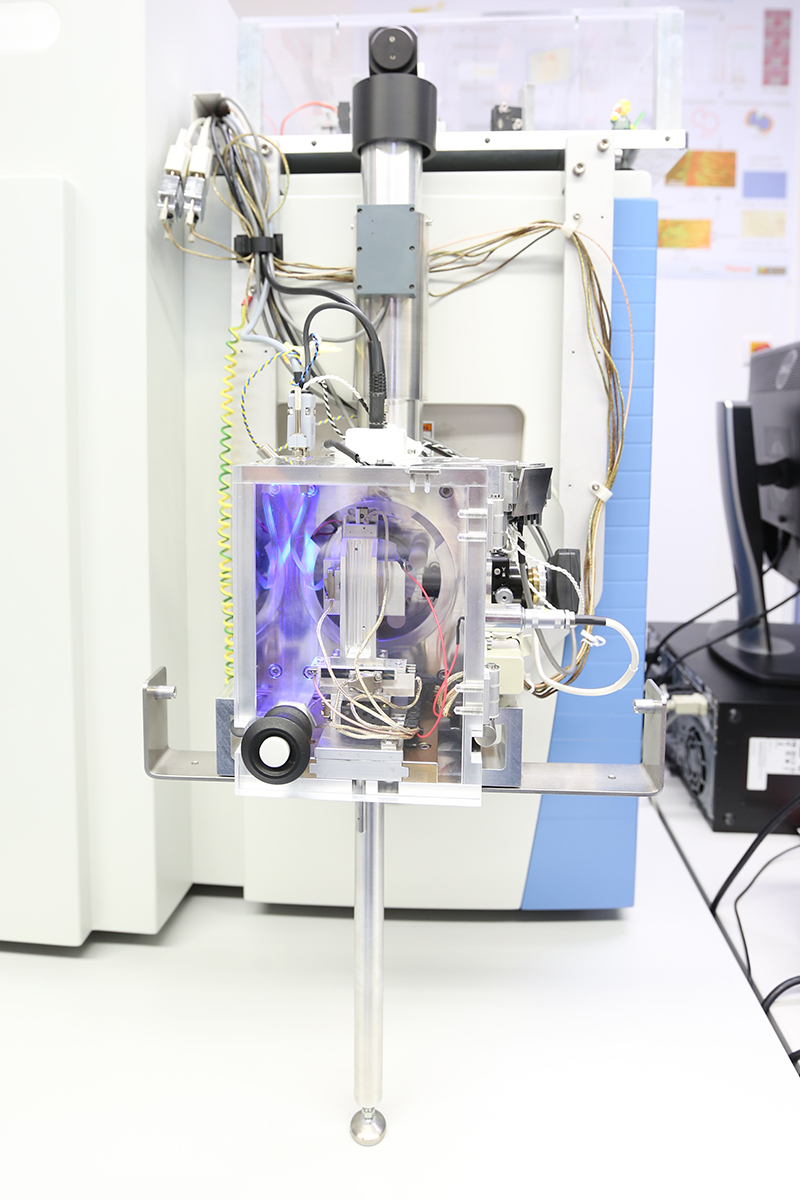
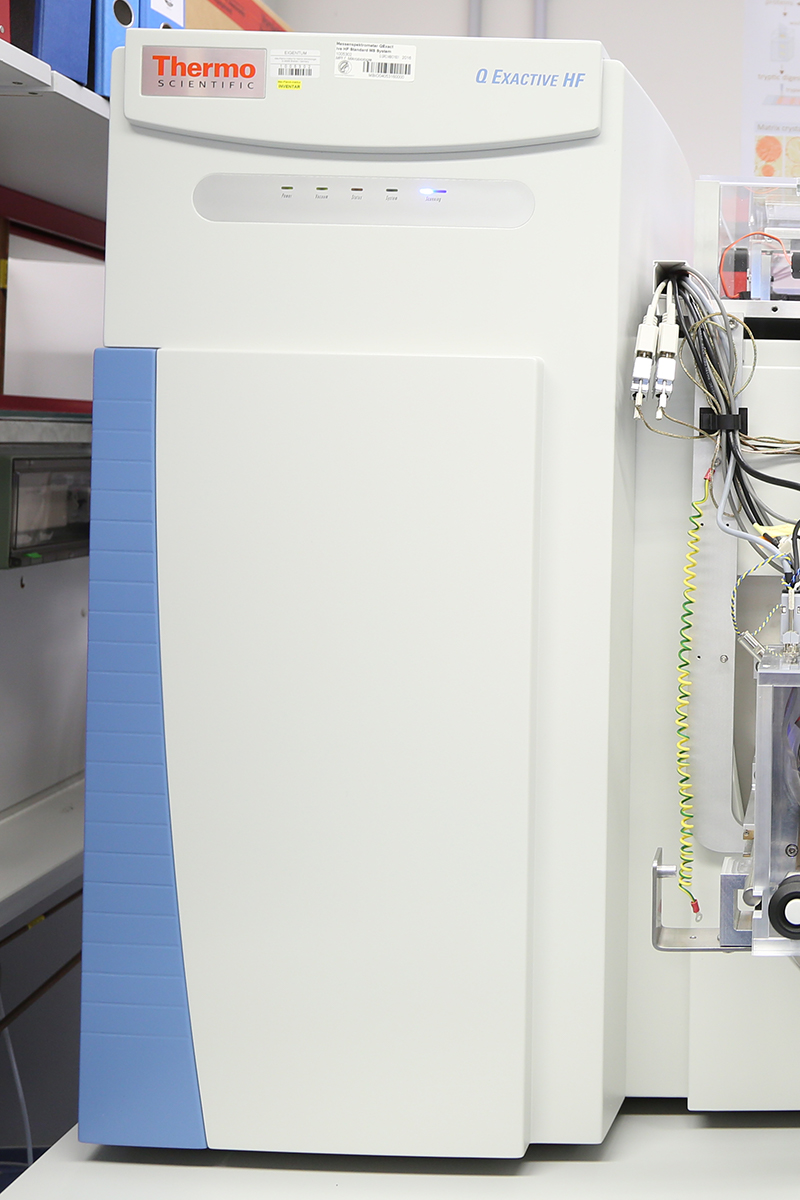
The MALDI imaging mass spectrometer in action
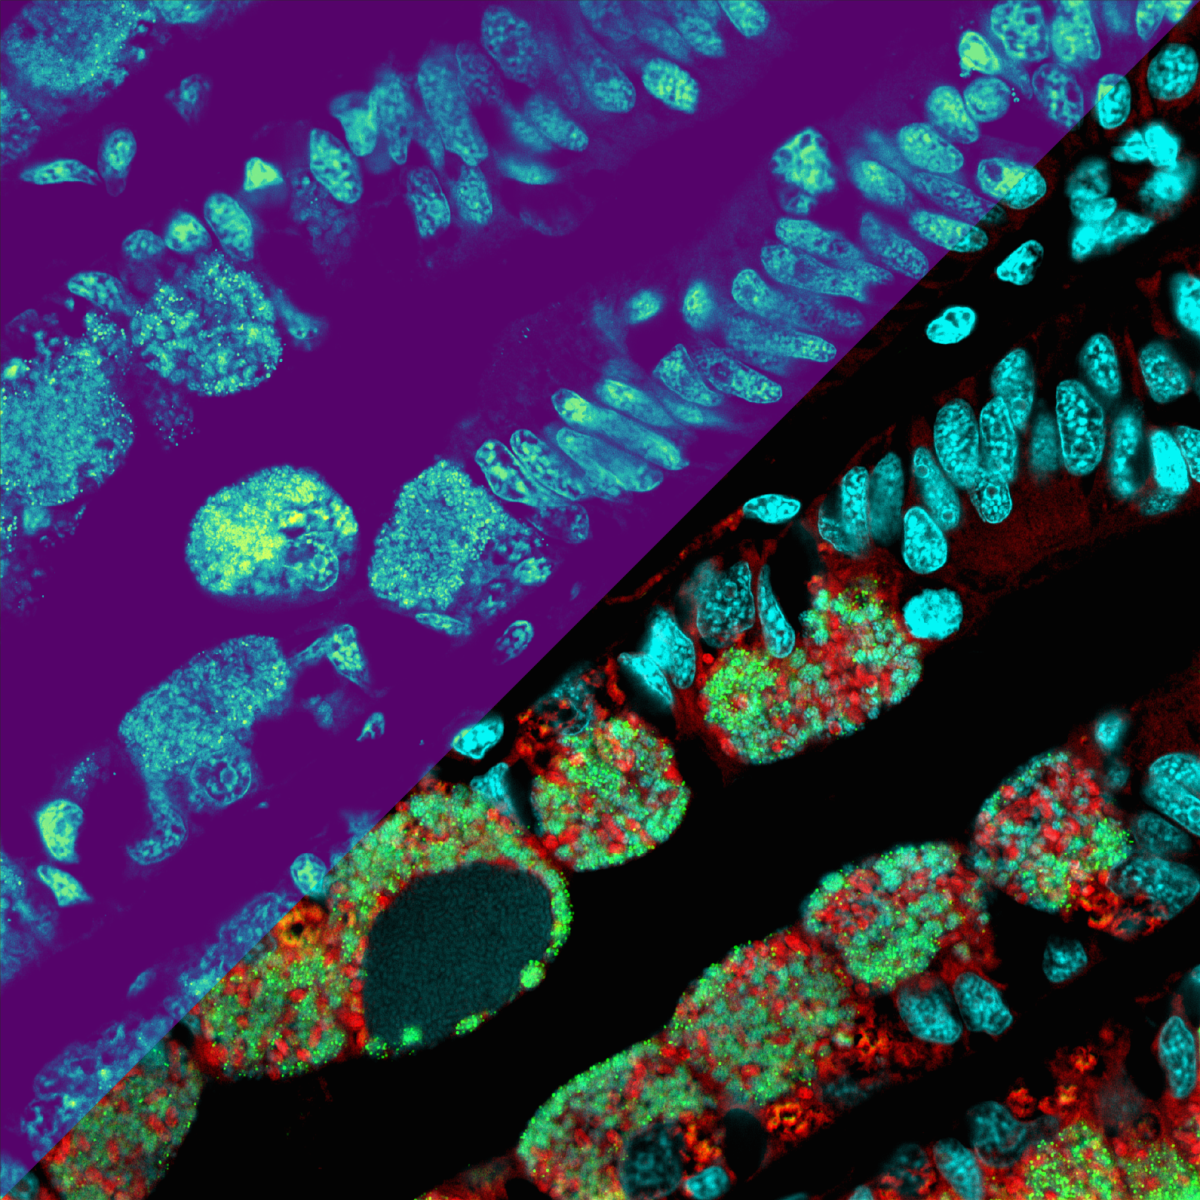
Snapshot of molecules in a deep-sea symbiosis
A team of researchers led by Benedikt Geier and Manuel Liebeke from the Max Planck Institute for Marine Microbiology in Bremen have developed a method that can be used to identify individual bacteria and detect which intermediate metabolites are present in the cell. With the new method, they are investigating how bacteria live and survive as symbionts in deep-sea mussels. Liebeke and his team analysed hundreds of metabolites on an area smaller than 1 mm2 using the MALDI mass spectrometer. This allows them to see how symbiotic microbes live in their host and interact at the chemical level. They take a “snapshot” of the bacteria actively at work in their natural environment – in this case inside an animal cell.
However, accurate conclusions from the images are possible only if it is also known who generates or uses them. In order to solve this problem, the researchers used an additional method called fluorescence in situ hybridization (FISH) in order to identify individual bacterial cells in the respective sample. By combining this with FISH, they can now explain MALDI images in a meaningful way and assign them to the bacteria in the mussel tissue.
- More information is available in the Press release “The secret life of microbes: Snapshot of molecules in a deep-sea symbiosis”
- Article in the journal Biospektrum: “Making the chemical language of symbioses visible”
- For this innovative method, Benedikt Geier received the MSI Award, which is presented annually for outstanding scientific work using imaging techniques with a mass spectrometer. Read more here.
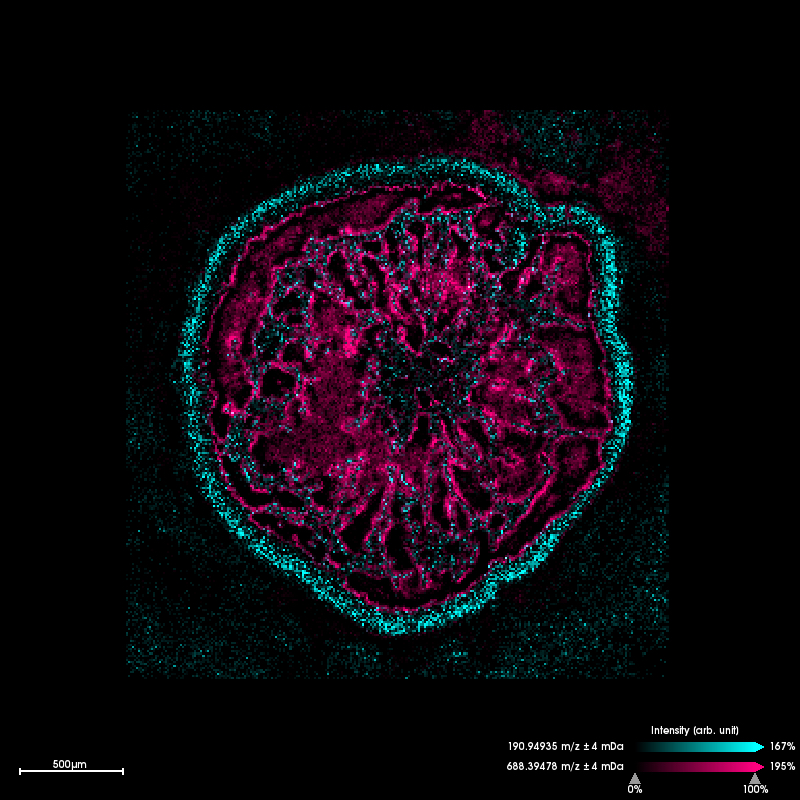
Seagras roots
Creating images for individual chemical compounds works not only with animal tissue but also with plants. One example from our research is seagras. Shown here is the cross-section through a seagras root and how certain chemical compounds are distributed there. On the one hand, you can see substances that occur only on the outside of the root and thus interact directly with the sediment. Other compounds occur only inside the root. As you might imagine, these are mostly storage substances such as lipids.
Who uses the MALDI imaging mass spectrometer?
The MALDI imaging mass spectrometer is mostly used by the Metabolic Interactions Group of the Symbiosis Department. However, other researchers at the Institute and guest scientists also have the opportunity to use the device if necessary. Such interdisciplinary cooperation between several working groups results in exciting projects from which all participants can benefit.
Please direct your queries to
Group leader
MPI for Marine Microbiology
Celsiusstr. 1
D-28359 Bremen
Germany
|
Room: |
3244 |
|
Phone: |

Technician
MPI for Marine Microbiology
Celsiusstr. 1
D-28359 Bremen
Germany
|
Room: |
2506 |
|
Phone: |
