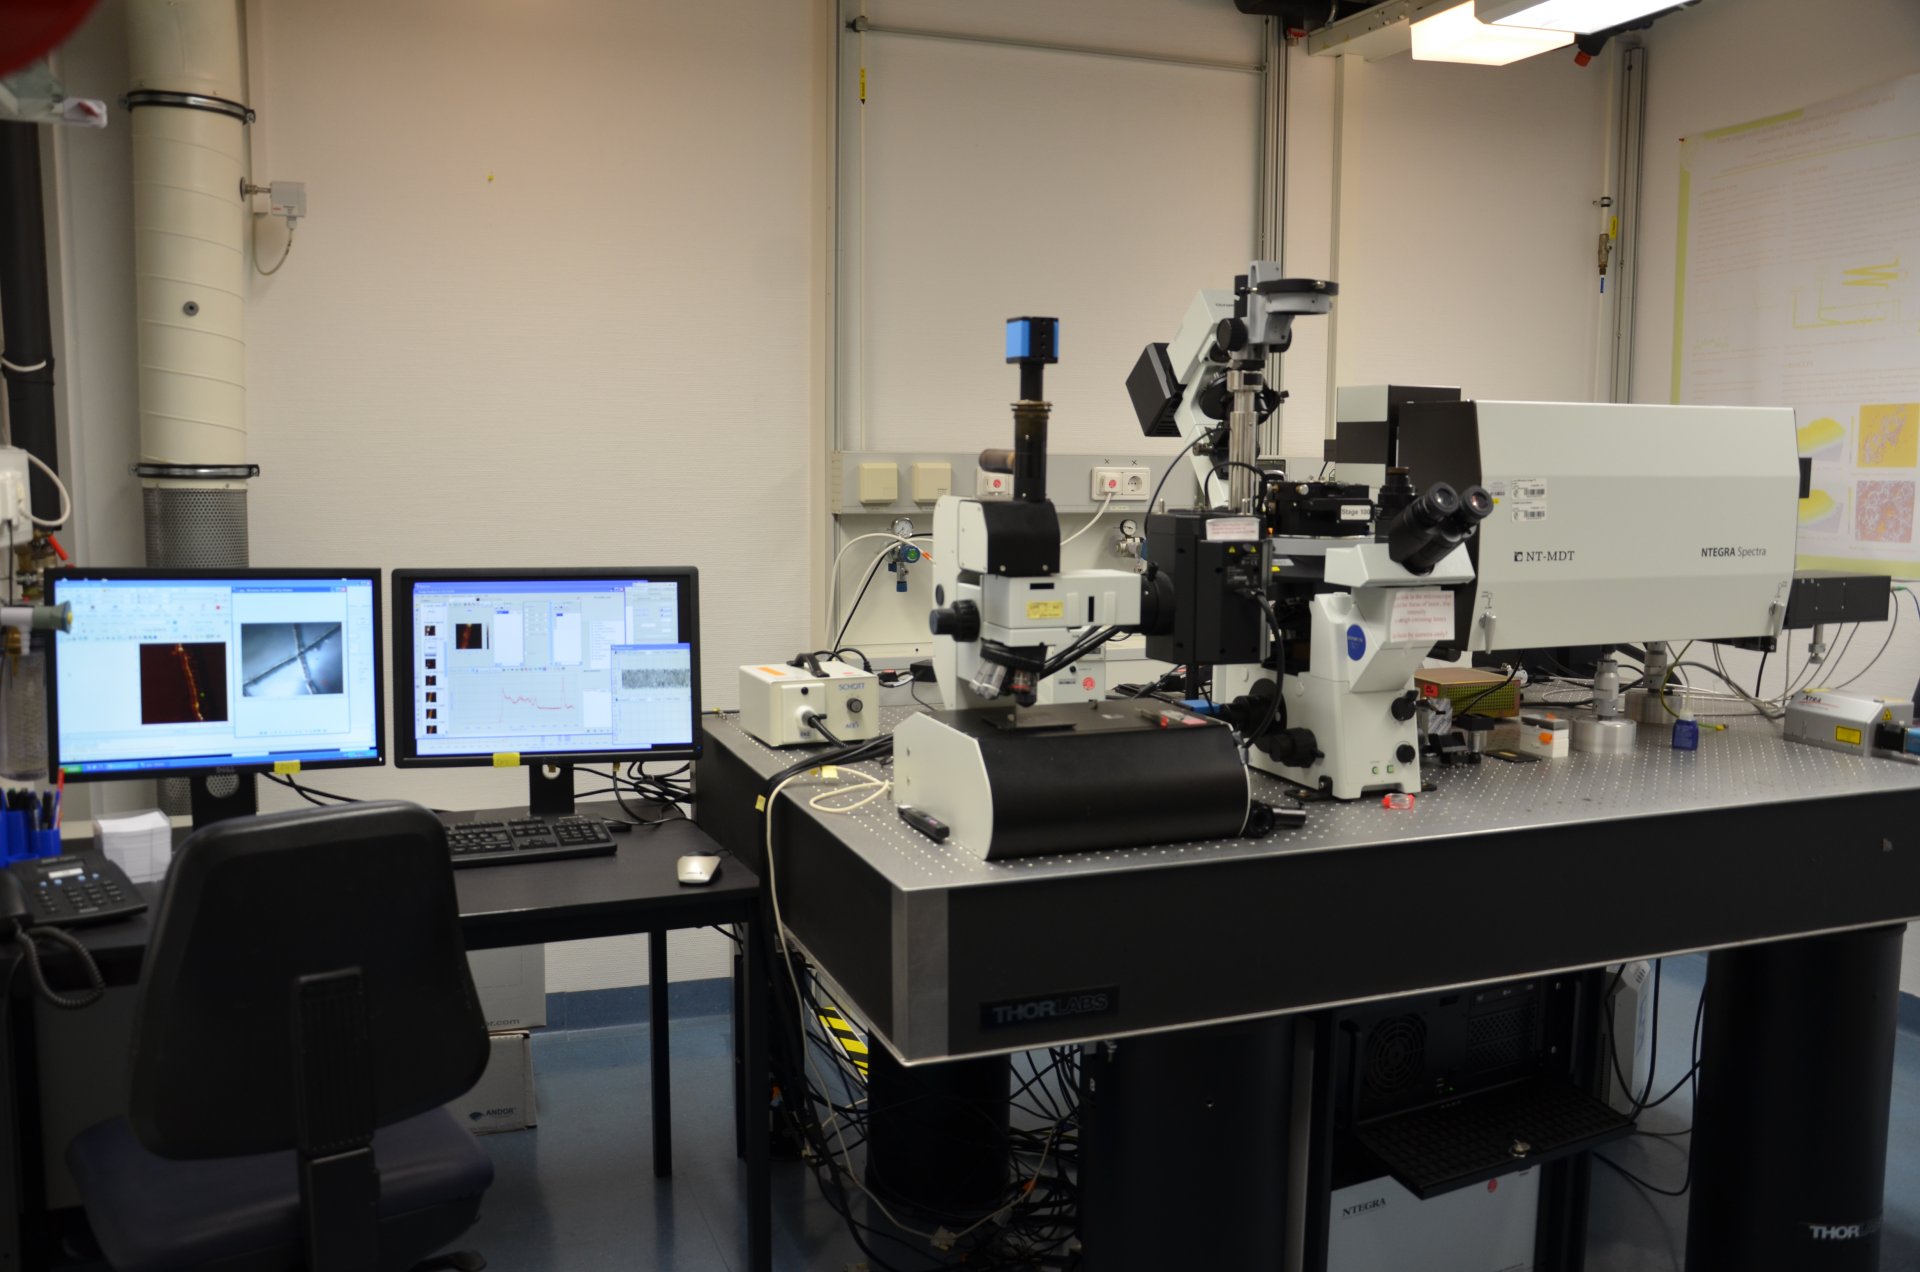
The Raman spectrometer
What is Raman spectrometry?
Raman spectrometry is named after the Indian physicist, C. V. Raman. In 1928, Raman was the first scientist to demonstrate that light is scattered inelastically by molecules or solids. This means that part of the kinetic energy of the light is transferred to the molecule or solid, thereby exciting it. This effect is what Raman spectroscopy is all about.
What is a Raman spectrometer used for?
The Raman spectrometer is used to investigate material properties. Material properties refer to the composition of the chemical compounds of an object or a sample as well as properties such as the type of structure in which the molecules, atoms, or ions are arranged (crystallinity) or the presence of any foreign atoms (doping). RAMAN spectroscopy is used in many different fields. For example, in mineralogy to identify minerals, in archaeology to examine finds, and in food chemistry to examine carbohydrates as a component of food. At our Institute, we use Raman spectroscopy to examine biological samples. We work with bacterial cultures or micro-organisms from different habitats (e.g. oceans and freshwater lakes).
The great advantage of the device is that it allows non-destructive and non-contact measurement. Furthermore, only very small amounts of a biological sample are needed. For example, RAMAN spectroscopy can help us determine whether bacteria in a water sample contain certain storage substances. The storage substances can be different for each species.
How does the Raman spectrometer work?
As the name suggests, the spectrometer can be used to display spectra. A spectrum provides information about the frequencies or intensities of objects in a set that all have a common property. The best known is certainly the colour spectrum. Here, different wavelengths of light become visible as colours. At our Institute, we mostly work with mass spectra, which are non-optical spectra. The result is a line spectrum in which frequencies are displayed as peaks.
Raman spectroscopy makes use of the rotation, oscillation, and realignment of the spin of a particle when it is excited by the (monochromatic) light of a laser. This means that when the laser is focused on the sample, the molecules start to oscillate, stretch, or bend and deform. This movement or change can then be shown in a spectrum.
For example, this happens with bonds between carbon and carbon or sulphur and sulphur as well as with bonds between carbon and many other atoms. The light scattered by the sample produces a spectrum and looks different for each sample.
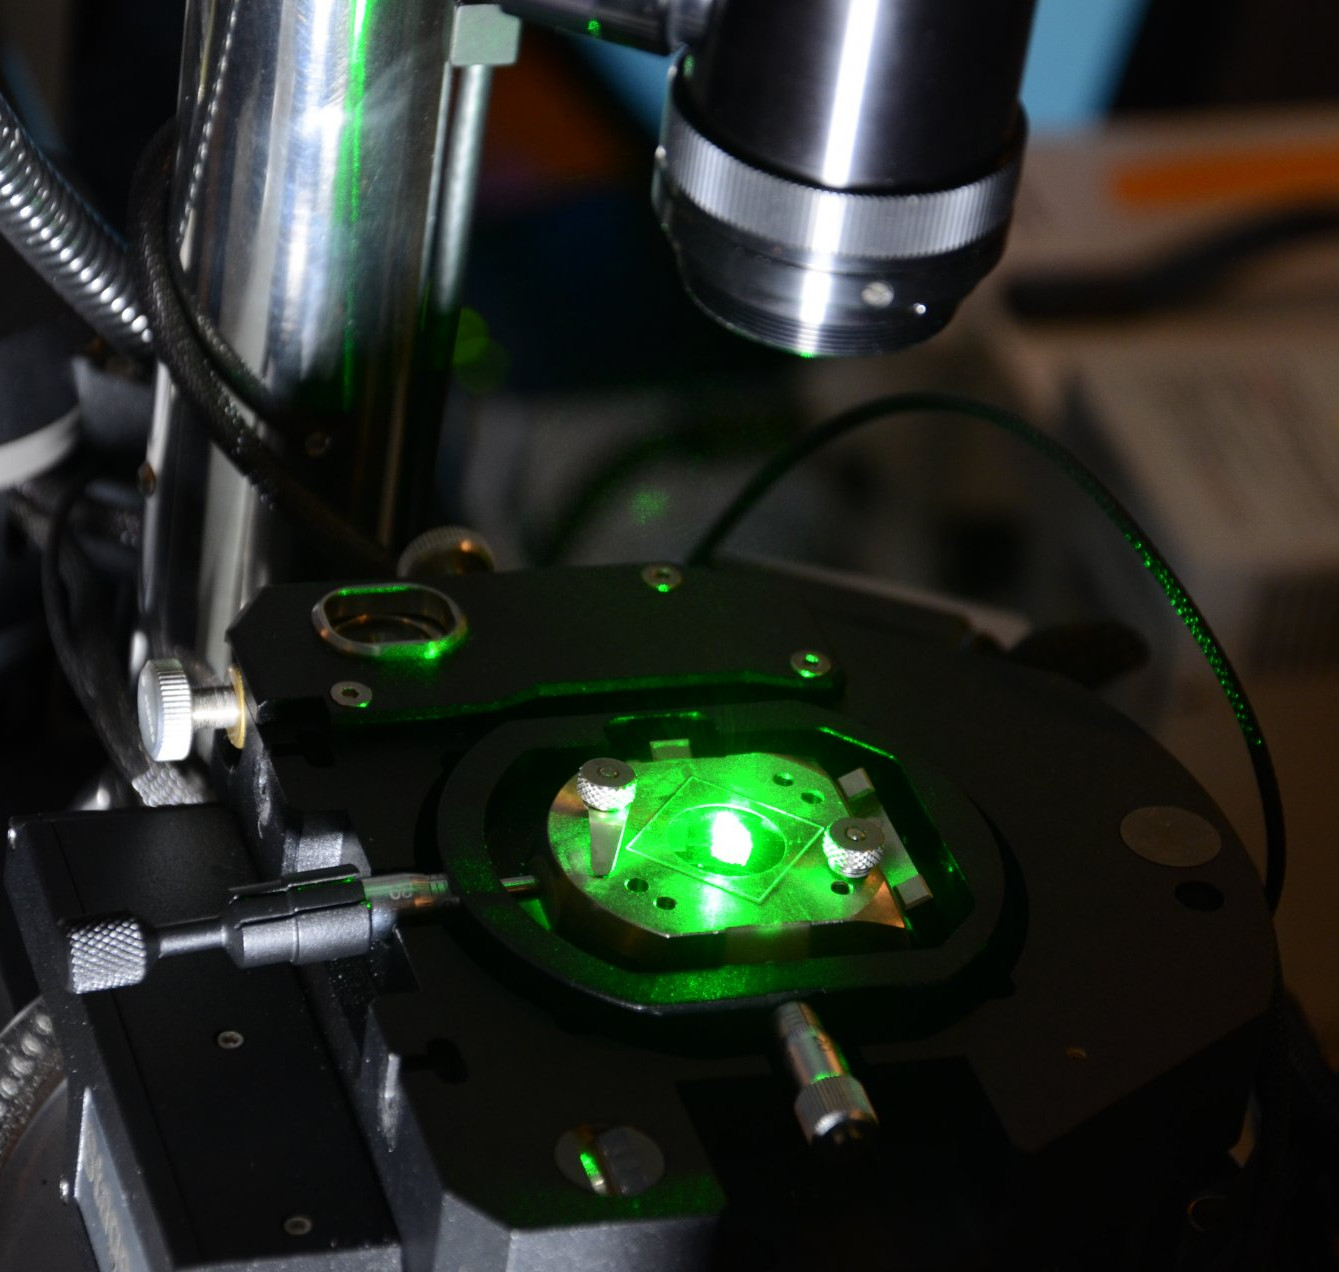
Lasers with different wavelengths can be used. Mostly lasers with longer wavelengths are used. Our system has a red laser with a wavelength of 785 nm and a green laser with a wavelength of 532 nm.

In confocal Raman spectroscopy, only a small part of the sample to be examined is illuminated with the laser light. The unfocused light is shielded. This increases the depth of field and contrast. This can also be extended to a three-dimensional scan. Non-destructive, non-contact measurement is possible with only small amounts of sample material (biological samples). The lateral resolution is less than 200 nm, and the exposure time is only seconds or milliseconds.
The Raman spectrometer in action
Raman spectroscopy allows statements to be made about whether the material in question has a dimorphic or polymorphic structure. This means that for compounds that have the same molecular formula – as is the case with the minerals pyrite and marcasite (both have the molecular formula FeS2) – the Raman measurement can distinguish between the two minerals based on their different structures.
The differences become visible in their spectra:

Or as in the following example of calcite and aragonite. Both are calcium carbonates with the molecular formula CaCO3.

Raman spectroscopy is also used in various aqueous systems (biotic and abiotic).
In this way, it was possible to show where certain bacteria store their storage substances and what was in the areas.
In the following example, bacterial filaments of the species Beggiato spp. were examined with Raman, and the spectra of different areas of a surface were recorded using a raster scan:
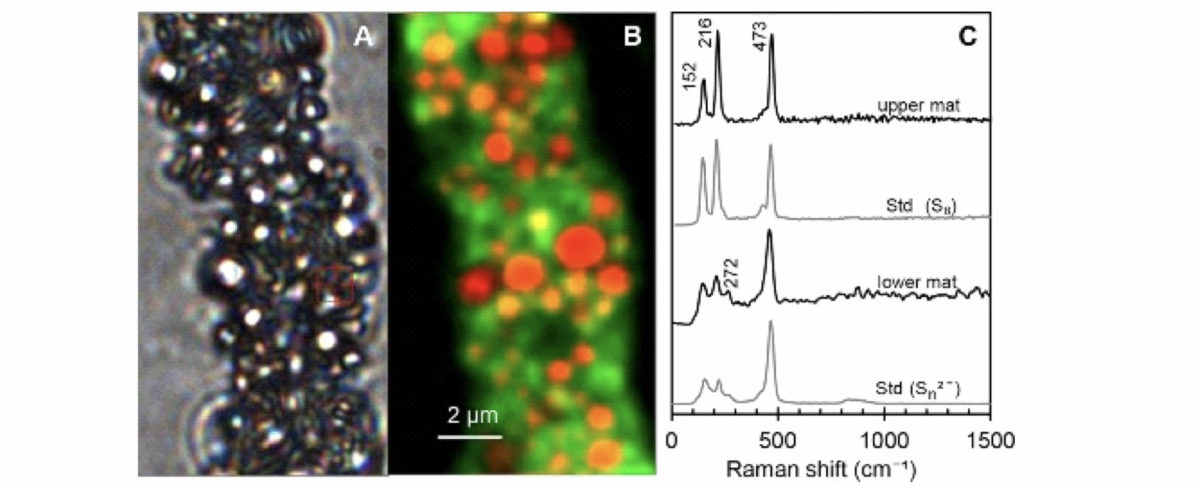
B) The same section of the filament was recorded with the Raman during a raster scan. In yellow/red, you see the sulphur (main peak at 473 cm−1) and the autofluorescence of the cells in green.
C) A recorded spectrum on a yellow/red dot shows sulphur inclusions in the form of cyclooctasulphur and as polysulphide. Above is a spectrum of an upper bacterial mat. In the third spectrum from the top is a lower bacterial mat. At the bottom is the spectrum of polysulphides.
Publikation: Polysulfides as Intermediates in the Oxidation of Sulfide to Sulfate by Beggiatoa spp., Jasmine S. Berg et al, Applied and Environmental Microbiology, 2013
Image A is a light microscope image and shows a filament of the species Beggiato spp.
The example shown above is from a publication on polysulphides as intermediates in the oxidation of sulphides to sulphates by Beggiatoa spp.
Standards were measured for comparison. This was elemental sulphur, which has a ring form (cyclooctasulphur). This sulphur ring shows three characteristic peaks (second position in Image C). In the upper mat of the Beggiato spp. colony, the three peaks in the Raman spectrum were also found (see
first spectrum in Image C). This means that cyclooctasulphur is also present here. The lower spectrum in Image C shows a standard of sulphur in chain structure (polysulphide). The spectrum is different; the first two peaks are smaller than in the cycloocta form. This structure was also found in the lower mat of a Beggiato spp. colony.
Another common method is the raster scan – also called Raman mapping. Here, many individual point spectra are recorded. These are combined line by line over a certain area to form one large image.
They help to find the areas of the cells where storage substances are present as well as how much storage substance is present in each area. The result of such a raster scan can be seen in Image B. It shows a Beggiato spp. filament with red and orange areas. Spectra of sulphur are located in these areas. The autofluorescence of the cell is shown in green.
Who uses the Raman spectrometer?
Scientists, PhD students, technicians from the Department of Biogeochemistry, MarMic students during the lab rotation, and visiting students.
Please direct your queries to:
Group Leader
Greenhouse Gases Research Group
MPI für Marine Mikrobiologie
Celsiusstr. 1
D-28359 Bremen
Deutschland
|
Room: |
3128 |
|
Phone: |

Scientist
MPI for Marine Microbiology
Celsiusstr. 1
D-28359 Bremen
Germany
|
Room: |
3130 |
|
Phone: |

Technician
MPI for Marine Microbiology
Celsiusstr. 1
D-28359 Bremen
Germany
|
Room: |
3131 |
|
Phone: |
